Lost Motivation for Weight Loss: The Plateau Was Scheduled
If you have lost your motivation for weight loss, check the calendar before you check your character. In the pooled evidence from 80 randomised trials with at least a year of follow up, weight comes off for roughly six months and then stops, and it stops whether or not the person keeps trying. The plateau is not a signal that you got lazy at month five. It is the single most reliably reproduced event in the entire field, and it arrives on schedule for almost everyone who starts.
What dies at that point is not your discipline. It is the payout. For six months the scale rewarded the work every week, and then the reward stopped arriving while the work stayed the same. Any reward loop treated that way goes quiet. The useful question at 45 is not how to want it more. It is what to measure once the measurement you started with stops paying.
Last reviewed September 11, 2026. Every number below is quoted from the linked peer-reviewed paper, and where a finding comes from a small or unusual sample that is stated in the sentence rather than buried. Population-level results describe groups, not you specifically. This is general information and not medical advice. If your weight has changed without you changing anything, or you are managing diabetes, thyroid disease, or a medication known to affect weight, the sequence starts with a doctor rather than with a diet.
The short answer
You have not lost the motivation. The feedback stopped and the motivation followed it, in that order.
Weight loss in trials follows one shape almost every time: a steep drop for about six months, a plateau, then a slow partial regain that levels out well above zero. That shape is not a description of people failing. It is what happens to a body that is being run at a deficit while it gets smaller, lighter and cheaper to operate, and it happens alongside a slow upward drift in what the person is actually eating, which they do not see and cannot report accurately.
So the fix is not a harder version of the thing that stopped working. It is to stop running your effort off a number that is designed to go flat, and to run it off something that keeps moving after month six. That means measuring what you can do rather than what you weigh, and it means aiming at a target far smaller than the one currently in your head.
If the flatness is wider than food, if it has taken your work and your interests with it, that is a different problem with a different answer and three separate conditions wear that same face. If what has gone is specifically the will to train, the gap there is between intending and doing, and it is covered separately.
The plateau is the most predictable event in the whole literature
In 2007 a team searched for every weight-loss randomised trial with at least twelve months of follow up, found 80 of them, and pooled what happened at 6, 12, 24, 36 and 48 months across eight kinds of intervention. The result is the closest thing this field has to a standard curve.
Interventions built on a reduced-energy diet, with or without weight-loss medication, produced a mean loss of 5 to 8.5 kg in the first six months, which is 5 to 9 percent of body weight. Then, in the authors' own phrasing, weight plateaus at approximately 6 months. Not for the people who quit. For the pooled average of everyone still in the trials.
Two details in that paper deserve more attention than they usually get.
The first is that advice-only and exercise-alone groups lost almost nothing at any time point. That is a harder finding than it sounds, and it is the reason a later section of this article is about exercise specifically.
The second is more encouraging than the plateau framing suggests. In the studies that ran out to 48 months, a mean of 3 to 6 kg stayed off, and none of the groups regained all the way back to baseline. The curve flattens and gives some ground back. It does not reset you to where you started. Four years after beginning, the average participant was still lighter.
A 2018 clinical review of long-term weight management describes the same trajectory as the typical one: early weight loss, a plateau, and progressive regain. That paper is a narrative review rather than a pooled analysis, so treat it as the field's summary of the shape rather than as a fresh measurement of it. The shape itself is not in dispute.
Two things happen at the plateau, and only one of them is your doing
This is where most writing on the subject picks a side and gets it wrong. One camp says the plateau is metabolic and outside your control. The other says it is entirely a matter of eating more than you admit. Both halves are measured, both are real, and they need holding at the same time.
The body's half: adaptation is real, and it persists
The cleanest measurement of the metabolic side comes from an unusual place. Researchers followed 16 contestants from a televised weight-loss competition, then went back six years later. Fourteen took part in the follow up.
At the end of the 30 week competition these men and women had lost a mean of 58.3 kg, with a standard deviation of 24.9, and their resting metabolic rate had fallen by 610 kcal a day. Six years later they had regained a mean of 41.0 kg of it. Their resting metabolic rate was still 704 kcal a day below where it started, and the metabolic adaptation, meaning the part of that drop left over after accounting for their changed body composition and age, was 499 kcal a day.
Five hundred calories a day, still missing, six years later. That is a real headwind and it deserves to be said plainly, because men at the plateau are routinely told the resistance they feel is imaginary.
Now the part of that paper almost nobody quotes, and it is the part that matters most to you.
Metabolic adaptation at the end of the competition did not predict who regained weight. The correlation was essentially nothing, r of -0.1 with a p value of 0.75. And among the participants who had kept the most weight off after six years, metabolic slowing at the six year mark was greater, not smaller, with an r of 0.59 and a p value of 0.025. The people doing best were carrying the biggest adaptation.
Read that twice, because it inverts the usual excuse. The suppressed metabolism was not the thing that dragged people back up. It travelled with the people who stayed down. The authors describe adaptation as a proportional but incomplete response to whatever you are currently doing to hold your weight lower, which means it is a tax on maintenance rather than a verdict on it.
The caveat is large and belongs in the same breath. This is 14 people. They were put through an extreme televised intervention with a rate of loss no clinician would prescribe. It is the sharpest measurement of adaptation anyone has, and it is not a model of an ordinary man losing 9 kg over six months.
Your half: the estimate drifts, and it drifts more than you would believe
In 1992 a group of researchers took 224 consecutive patients presenting for obesity treatment and isolated a subgroup of 10 who reported eating under 1,200 calories a day and still not losing weight. The obvious hypothesis was a broken metabolism. They tested it properly, with indirect calorimetry and body composition analysis, over 14 days.
The finding was that total energy expenditure and resting metabolic rate in those 10 people sat within 5 percent of what their body composition predicted. There was no thermogenic abnormality. What there was instead: they underreported their actual food intake by a mean of 47 percent, with a standard deviation of 16, and overreported their physical activity by a mean of 51 percent.
Handle those two numbers differently, because they are not equally solid. The intake figure is tight and the variation around it is modest. The activity figure carries a standard deviation of 75 percent, which is wider than the estimate itself, so treat it as a direction rather than a quantity.
Two more limits worth stating. The sample is 10 people, of whom nine were women and one was a man. And they were selected precisely because they were the hardest cases in the clinic, so this is the upper end of the effect rather than the average.
What it establishes is still the important thing, and it has held up in the three decades since. When intake is measured rather than reported, the gap that opens is on the reporting side. Not deceit. The paper notes these people had no distinct psychopathology and described their eating as normal. Portions grow, the bites that do not count start counting, and the diary stays honest while the estimate behind it quietly goes stale.
So the plateau is both things at once. The body is running a few hundred calories cheaper than it used to, and the intake has drifted up by an amount you cannot feel. Between them they close a deficit that was never large to begin with, and the scale goes flat while nothing visible has changed.
Why adding exercise does not rescue it the way you expect
The standard response to a stalled scale is to add training. It is the right move for almost every reason except the one men make it for.
A 2012 systematic review asked directly why exercise interventions produce less weight loss than the arithmetic predicts. It gathered studies that monitored whether participants actually did the prescribed exercise and measured the change in body composition, then computed the implied energy balance. The conclusion names two causes and neither is exotic: the prescribed exercise doses were small in energy terms, and food intake rose at the same time.
That fits the 2007 pooling, where exercise-alone groups lost minimal weight at every time point while diet-based groups lost 5 to 8.5 kg. It is not that training does nothing. It is that training is a poor lever on the scale specifically, because the energy it burns is modest and appetite quietly answers it.
None of which is an argument against lifting or walking, and this magazine has argued the opposite at length: how little strength training actually takes and what is actually leaving your body after 40. Train because of what it does to your function, your strength and your risk of dying. Just stop asking the scale to be the thing that reports back on it, because on that particular measure it will keep underpaying you.
What the largest lifestyle trial ever run actually delivered
Look AHEAD randomised 5,145 overweight or obese adults with type 2 diabetes to an intensive lifestyle intervention or to diabetes support and education, and followed them for a median of 9.6 years before stopping early for futility.
The weight results are the standard curve again, drawn at the largest scale anyone has managed. The intervention group was 8.6 percent lighter at one year against 0.7 percent in the control group. At the end of the study that gap had narrowed to 6.0 percent against 3.5 percent. Nearly a decade of the most intensive lifestyle support ever delivered in a trial, and the durable difference was about two and a half percentage points of body weight.
And the primary outcome, a composite of cardiovascular death, heart attack, stroke and hospitalisation for angina, was not reduced. The hazard ratio was 0.95 with a confidence interval from 0.83 to 1.09.
Two boundaries on how far that travels. This was a population with established type 2 diabetes, most of them already on cardiovascular medication, which is not the reader of this article. And the trial reported greater improvements in glycated haemoglobin, fitness and every cardiovascular risk factor except LDL cholesterol. The lifestyle change did plenty. It did not move that specific endpoint in that specific population.
The honest reading for a man of 45 is the middle one. Sustained, well-supported weight loss is worth roughly 6 percent over the long run, not 25, and it buys real improvements in things you can measure while not being a guarantee against anything.
| Trial or review | What it measured | Weight result | The caveat to carry |
|---|---|---|---|
| Franz and colleagues, 2007 | 80 randomised trials, minimum 12 month follow up | 5 to 8.5 kg by 6 months, plateau, 3 to 6 kg still off at 48 months | Simple pooling across heterogeneous trials, with meta-analysis supporting the effect sizes |
| Fothergill and colleagues, 2016 | Resting metabolic rate 6 years after an extreme competition | 58.3 kg lost, 41.0 kg regained, adaptation of 499 kcal a day persisting | 14 people, an extreme intervention, not a model of ordinary dieting |
| Lichtman and colleagues, 1992 | Measured against reported intake in self-described diet-resistant adults | Intake underreported by 47 percent, expenditure normal | 10 people, 9 of them women, selected as the hardest cases |
| Look AHEAD, 2013 | Intensive lifestyle support against education, 5,145 adults with type 2 diabetes | 8.6% against 0.7% at year one, 6.0% against 3.5% at study end | Diabetes population. No reduction in the cardiovascular composite |
| Diabetes Prevention Program, 2002 | 3,234 adults with elevated glucose, mean age 51 | A 7 percent loss target, with 58 percent lower diabetes incidence | 68 percent of participants were women. Outcome is diabetes, not weight |
The target in your head is probably three times too big
The Diabetes Prevention Program randomised 3,234 adults with raised fasting and post-load glucose to placebo, to metformin, or to a lifestyle programme. The participants had a mean age of 51 and a mean body mass index of 34.0. The lifestyle arm was given two goals and they were modest ones: at least 7 percent weight loss, and at least 150 minutes of physical activity a week.
Over an average of 2.8 years the incidence of type 2 diabetes was 11.0 cases per 100 person-years on placebo, 7.8 on metformin and 4.8 in the lifestyle group. The lifestyle programme cut the incidence by 58 percent, with a confidence interval from 48 to 66 percent, and beat the drug. Seven people had to go through the programme for three years to prevent one case.
Seven percent. For a man of 95 kg that is 6.7 kg, and it sits comfortably inside what the pooled six-month curve delivers before the plateau ever shows up. It is the amount most men would dismiss as not really having worked.
The caveats: 68 percent of the participants were women, and the outcome measured was diabetes rather than weight maintenance, so this tells you what a 7 percent loss is worth rather than how to keep it. What it settles is the size of the target. The evidence-backed goal is a number you can hit inside the part of the curve that still moves.
What to measure once the scale stops paying
The scale is a good instrument for about six months and a poor one after that, which is exactly backwards to how most men use it. Replace it, or at least demote it, with measures that keep responding when body weight has gone flat.
| Instead of | Measure this | Why it keeps moving after month six |
|---|---|---|
| Weight, weekly | Weight, as a 7 day rolling average, checked monthly | Removes the daily noise that makes a flat month look like a bad one |
| The scale as the only readout | Waist at the navel, same time of day, monthly | Body composition continues to change through a weight plateau |
| Calories eaten, estimated | Calories eaten, weighed, for two weeks twice a year | Directly attacks the 47 percent drift, which no amount of care fixes by feel |
| Gym attendance | Load lifted, or distance walked at a given pace | A performance number goes up for years after weight stops falling |
| A goal weight | A 7 percent target, then a maintenance phase with no target at all | It is the figure with a measured outcome attached, and it is reachable before the plateau |
The maintenance row is the one men skip, and the 2018 clinical review is explicit that maintenance needs its own attention and its own counselling rather than being the leftover state after a diet ends. Treating maintenance as the absence of a project is how the regain half of the curve gets drawn.
What this article is not
It is not a claim that weight loss does not work. Four years out, the pooled trials still had people lighter than they started, and no group had regained to baseline.
It is not a claim that your metabolism is the problem. In the one study that measured it directly in people convinced it was, expenditure was normal and the gap was in the reporting. In the study where adaptation was profound and real, adaptation did not predict who regained.
It is not medical advice, and it is not about medication. Weight-loss drugs have changed a great deal since these trials were run and this article deliberately says nothing about them. That is a conversation with a doctor, not with a magazine.
And it is not a promise that 7 percent will fix how you feel about your body. It is the figure with an outcome attached in a trial of 3,234 people whose average age was almost exactly yours.
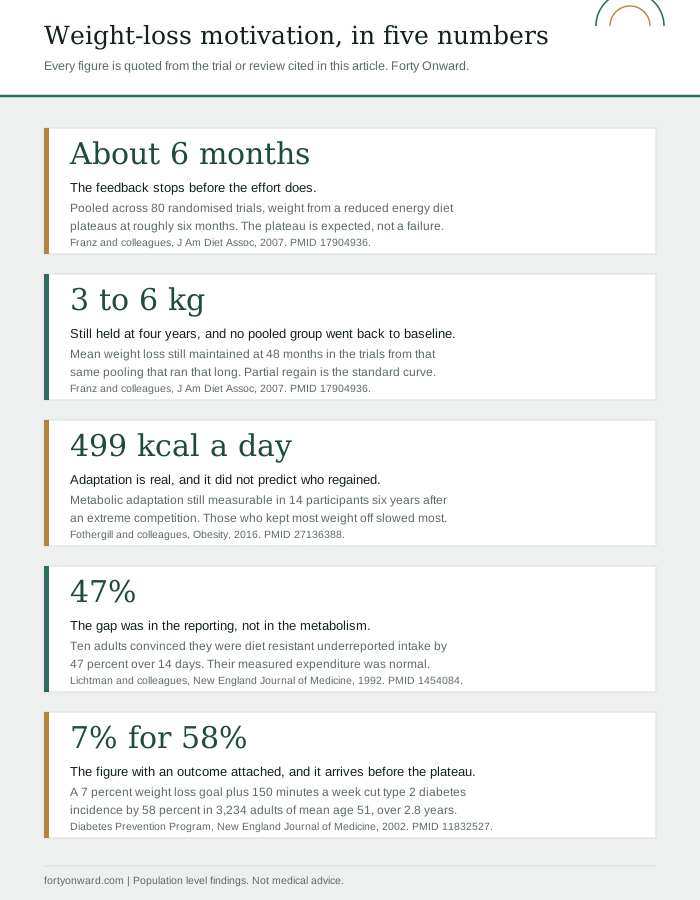
Weight-loss motivation in five numbers
| The number | What it is | Source |
|---|---|---|
| About 6 months | Where weight plateaus in pooled trials of reduced-energy diets | Franz and colleagues, 80 randomised trials, J Am Diet Assoc 2007 |
| 3 to 6 kg | Mean weight loss still maintained at 48 months, with no pooled group back at baseline | Franz and colleagues, J Am Diet Assoc 2007 |
| 499 kcal a day | Metabolic adaptation still present 6 years after an extreme weight-loss competition | Fothergill and colleagues, 14 participants, Obesity 2016 |
| 47% | Underreporting of actual food intake among 10 adults resistant to dieting, with normal measured expenditure | Lichtman and colleagues, NEJM 1992 |
| 58% | Reduction in type 2 diabetes incidence from a 7 percent weight-loss goal plus 150 minutes a week | Diabetes Prevention Program, 3,234 adults, NEJM 2002 |
FAQ
Why have I lost all motivation to lose weight?
Most likely because the feedback stopped before the effort did. Pooled across 80 randomised trials, weight comes off for about six months from a reduced-energy diet and then plateaus, so a man who started in January is standing at the flat part of a curve by summer while still doing the work. A reward loop that pays weekly and then pays nothing goes quiet, and that feels from the inside like losing motivation. If the flatness extends well beyond food and training, that is a different problem and it needs a different check.
Is a weight-loss plateau at six months normal?
It is the expected result rather than an exception. The 2007 pooling of 80 trials reports plateaus at approximately six months across interventions using a reduced-energy diet, and a 2018 clinical review describes early loss followed by a plateau and progressive regain as the typical trajectory of obesity interventions. Hitting one does not mean the approach failed.
Has my metabolism been damaged by dieting?
Adaptation is real but it is not the thing usually blamed. Six years after an extreme televised competition, 14 participants still carried a metabolic adaptation of 499 kcal a day. In the same study, adaptation at the end of the competition did not predict who regained weight, and the participants who had kept the most weight off showed greater metabolic slowing, not less. Separately, in 10 adults who reported eating under 1,200 calories a day without losing weight, measured energy expenditure sat within 5 percent of what their body composition predicted.
Why am I not losing weight when I am eating so little?
The most likely explanation is the gap between reported and actual intake, which is large and largely invisible. Measured over 14 days against indirect calorimetry, 10 self-described diet-resistant adults underreported their food intake by an average of 47 percent. They were not lying and had no unusual psychology. The practical answer is to weigh food for two weeks rather than estimating it, which recalibrates a number that goes stale on its own.
Will more exercise break the plateau?
Less than the arithmetic suggests. A 2012 systematic review of exercise interventions concluded that the small weight losses observed came mainly from low prescribed exercise energy expenditures combined with a rise in food intake. In the 2007 pooling, exercise-alone groups lost minimal weight at every time point. Train for strength, function and risk. Do not appoint the scale as the judge of whether the training worked.
How much weight do I actually need to lose to get a health benefit?
Less than most men assume. The Diabetes Prevention Program set a goal of at least 7 percent weight loss plus at least 150 minutes of activity a week in 3,234 adults of mean age 51, and cut type 2 diabetes incidence by 58 percent over an average of 2.8 years, outperforming metformin. Note that 68 percent of those participants were women and the measured outcome was diabetes rather than body weight itself.
If I have regained some of the weight, was the whole thing pointless?
No, and the pooled data is unusually clear here. In the trials that ran to 48 months, a mean of 3 to 6 kg of loss was still maintained and none of the groups regained all the way to baseline. Partial regain is part of the standard curve, not evidence that the effort was wasted.
How long should I stay on a diet before deciding it is not working?
Judge the first six months on weight and everything after that on something else. A reduced-energy diet that has produced 5 to 9 percent of body weight by month six is performing exactly as the pooled evidence says it should. After that, a flat scale is the expected reading, so the honest test of whether the work is paying becomes waist measurement, load lifted, or pace held, all of which keep improving through a weight plateau.
Sources
- Franz MJ, VanWormer JJ, Crain AL, and colleagues. Weight-loss outcomes: a systematic review and meta-analysis of weight-loss clinical trials with a minimum 1-year follow-up. Journal of the American Dietetic Association, 2007, volume 107, pages 1755 to 1767. 80 randomised trials. PMID 17904936.
- Fothergill E, Guo J, Howard L, and colleagues. Persistent metabolic adaptation 6 years after "The Biggest Loser" competition. Obesity, 2016, volume 24, pages 1612 to 1619. 14 of the original 16 participants. PMID 27136388.
- Lichtman SW, Pestone M, Hirsch J, and colleagues. Discrepancy between self-reported and actual caloric intake and exercise in obese subjects. New England Journal of Medicine, 1992, volume 327, pages 1893 to 1898. Analytic subgroup of 10. PMID 1454084.
- Hall KD, Kahan S. Maintenance of lost weight and long-term management of obesity. Medical Clinics of North America, 2018, volume 102, pages 183 to 197. Narrative clinical review. PMID 29156185.
- Thomas DM, Bouchard C, Church T, and colleagues. Why do individuals not lose more weight from an exercise intervention at a defined dose? An energy balance analysis. Obesity Reviews, 2012, volume 13, pages 835 to 847. PMID 22681398.
- The Look AHEAD Research Group. Cardiovascular effects of intensive lifestyle intervention in type 2 diabetes. New England Journal of Medicine, 2013, volume 369, pages 145 to 154. 5,145 participants, median follow-up 9.6 years. PMID 23796131.
- Diabetes Prevention Program Research Group. Reduction in the incidence of type 2 diabetes with lifestyle intervention or metformin. New England Journal of Medicine, 2002, volume 346, pages 393 to 403. 3,234 participants, mean age 51. PMID 11832527.